Showing posts with label raytracer. Show all posts

Friday, June 3, 2016

Mandelbox Fractals and Flights

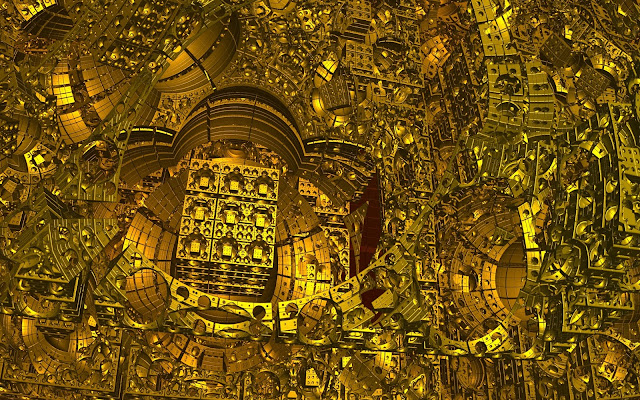
Deus Ex Machina – Example Mandelbox fractal image I created.


I’ve previously posted some images of Mandelbox fractals, so this time I’ll write more about them and provide a video I made of various flights through the Mandelbox.

The Mandelbox is a folding fractal, generated by doing box folds and sphere folds. It was discovered by Tom Lowe (Tglad or T’glad on various forums). The folds are actually rather simple, but surprisingly, produce very interesting results. The basic iterative algorithm is:

if (point.x > fold_limit) point.x = fold_value – point.x
else if (point.x < -fold_limit) point.x = -fold_value – point.x

do those two lines for y and z components.

length = point.x*point.x + point.y*point.y + point.z*point.z

if (length < min_radius*min_radius) multiply point by fixed_radius*fixed_radius / (min_radius*min_radius)
else if (length < fixed_radius*fixed_radius) multiply point by fixed_radius*fixed_radius / length

multiply point by mandelbox_scale and add position (or constant) to get a new value of point

Typically, fold_limit is 1, fold_value is 2, min_radius is 0.5, fixed_radius is 1, and mandelbox_scale can be thought of as a specification of the type of Mandelbox desired. A nice value for that is -1.5 (but it can be positive as well).

There’s a little more to it than that, but just as with Mandelbrot sets and Julia sets, the Mandelbox starts with a very simple iterative function. For those who are curious, the fold_limit parts are the box fold, and the radius parts are the sphere fold.

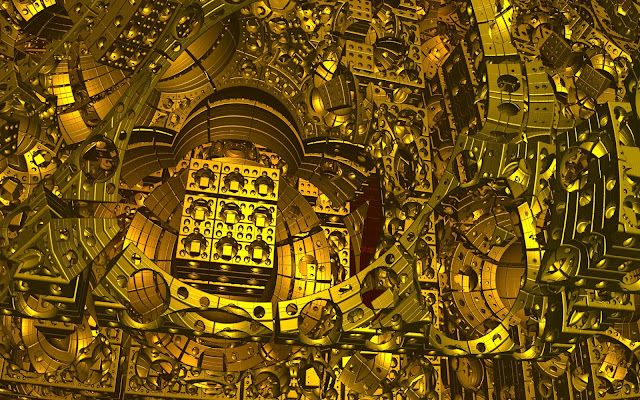
One of the parts that is left deals with what’s called ray marching. Since these types of fractals don’t have a simple parametric equation that can be easily solved without the need for iterations, etc., one must progress along the ray and ask “are we there yet?”. To help speed up this progression, an estimate of a safe distance to jump is calculated (using a distance estimator). Once the jump is made, the “are we there yet?” question is asked again. This goes on until either we get close enough or it’s clear we will never get there. The “close enough” part involves deciding ahead of time how precise we want the image to be. Since fractals have infinite precision/definition (ignoring the limitations of the computer, of course), there’s no choice but to at some point say “we’re close enough”. This basically means we’re rendering an isosurface of the fractal. To see what I mean, refer to both my “Deus Ex Machina” image and my “Kludge Mechanism” image. Kludge Mechanism uses a less precise setting and therefore has less features.
Kludge Mechanism – Example Mandelbox fractal image I created

The ray marching technique (and distance estimator method) can be used to create a Mandelbulb, 4D Julia, Menger Sponge, Kaleidoscopic IFS (KIFS), etc. as well as non-fractal objects like normal boxes, spheres, cones, etc. But many of the non-fractal objects are better and faster calculated with parametric equations.

Now for the fun part (hopefully). Here’s a video I made using my raytracer. It shows various Mandelbox flights and even a section varying the mandelbox_scale from -4 to -1.5

One of the flights points out an interesting by-product of an attempt to speed up the ray marching. One can specify a bound radius in which anything outside of that radius doesn’t need to be run through the ray marching process. In my “Futuristic City Under Construction” flight, I accidentally set the bound radius too small which cut out some of the Mandelbox. But, in this case, it was, in my opinion, an improvement because it removed some clutter.
Futuristic City Under Construction (Small Bounding Radius)
Futuristic City Under Construction (Correct Bounding Radius)


I’ve also created another video showing just Deus Ex Machina but with higher resolution, more detail, and more frames. Even though it’s 1080p, I recommend using the 720p setting.


And another video showing just Futuristic City Under Construction but with much better camera movements, further flight, more detail, more frames, and 16:9 aspect ratio.

To better view these videos on my YouTube channel (with full control) go to: http://www.youtube.com/MrMcSoftware/videos


A lot more can be said on the subject of Mandelbox fractals, as well as a lot more images I created, but this will do for now.

Wednesday, June 1, 2016

The Electronics Behind My Raytraced NAND Gate IC Mask Layout Using A Gate Array

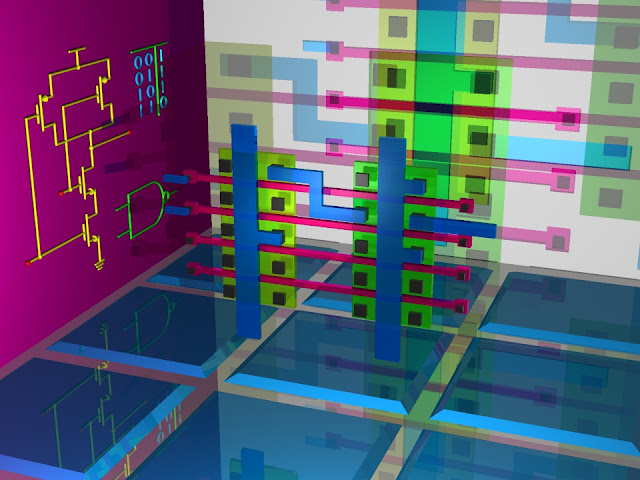
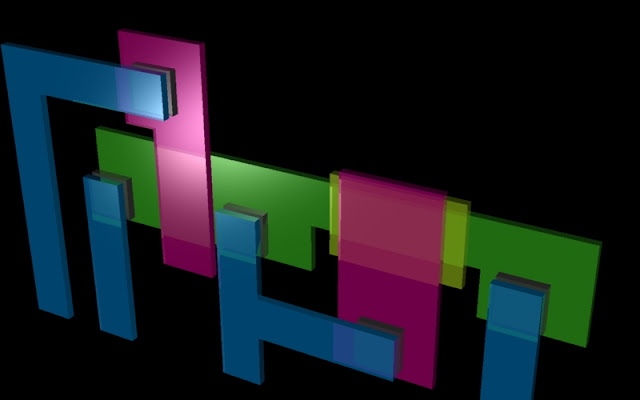
A raytraced colored glass integrated circuit mask layout of a NAND logic circuit made from a gate array.

Since my raytraced NAND circuit image (Integrated Circuit Mask Layout, etc.) is the most popular (in terms of views and downloads) image in my deviantArt gallery, I decided to write a blog post explaining the electronics behind this circuit.  Admittedly, chances are anyone interested in this image already knows the electronics part, but in case they don’t…  Now for the disclaimer:  I modeled (for my raytracer) the IC mask layout about 11 years ago, and I had a class in this subject about 26 years ago, so it’s not exactly fresh in my mind.


My Original Raytraced NAND IC Mask Layout (Modeled 11 Years Ago)

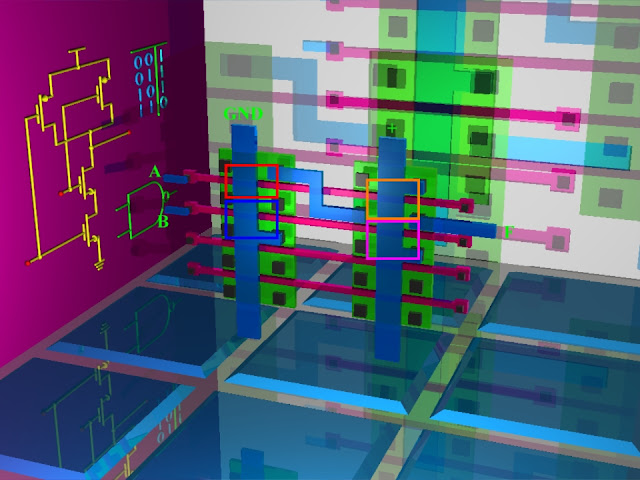
Annotated NAND Schematic (Encased In Glass)

Annotated NAND IC Mask Layout


The two images with annotations show how the schematic matches the IC mask layout.  For this discussion, GND is ground, + is Vdd, F is the NAND gate output, A and B are the NAND gate inputs, and the colored rectangles surround the individual transistors (which are color coded to match).

I’ll start by describing the schematic of the CMOS NAND logic circuit.  The two top transistors (side by side) are PMOS (p-channel metal-oxide-semiconductor) which are normally on (meaning when the voltage on the transistor input (gate) is zero, current flows between the drain and the source).  So, as long as either A or B or both are off (0), the output F receives Vdd (presumably, 5 volts).  The two bottom transistors are NMOS (n-channel metal-oxide-semiconductors) which are normally off (meaning when the voltage on the transistor input is zero, current doesn’t flow between the drain and the source).  In this configuration, both A and B have to be on (5 volts) in order for F to be tied to ground (thus a 0), and in this case, the top two transistors would be off (thus not providing Vdd).  Since both NMOS and PMOS transistors are used, this circuit is considered CMOS (complementary metal-oxide-semiconductor).  By the way, the direction of the arrows (of the transistors) in the schematic show which type of transistor it is, and the legs with the arrows are the sources (as opposed to the drains).

Now, I’ll describe the Integrated Circuit (IC) mask layout.  Integrated circuits are created using a sequence of masks. The basic mask sequence is transistor area mask, polysilicon gate definition mask, contact area mask, and then metal definition mask. Thus a mask layout represents the masks that would be used (the actual masks would have to be checked and modified to adhere to various spacing requirements). The blue areas are metal.  The gray areas are cuts which create possible contacts (for the metal areas).  The red areas are polysilicon (gates).  The green areas are heavily doped n+ or p+ regions (diffusion) (sources and drains).  Technically, the NMOS transistors (the green area on the left), have an “understood” or “assumed” p-type well diffusion.  I didn’t model that (p-type well diffusion) distinction.  Anywhere the red overlaps the green (polysilicon overlaps diffusion), a transistor is formed.  The red lines conduct electricity from end to end.  The left block creates the two bottom transistors (in the schematic), and the right block creates the two top transistors.  Therefore, the left metal strip is ground, and the right metal strip is Vdd (+5v).  The two red lines with metal attached are the NAND gate inputs (A and B).  The metal on the far right (attached to the green area through a cut) is the output of the NAND gate.  The squiggly metal in the middle connects the two sets of transistors together and to the output of the NAND gate.  With this information, you should be able to see how the mask layout matches the schematic.

Blank gate arrays are formed on the silicon wafer (with the polysilicon, diffusion, cuts, and basic metal strips (not contacting anything) all formed) in the first stages of the process.  Then all a manufacturer has to do is make the metal connections needed to form the desired circuit.  Kind of like writing to a blank CD-R (not as easy though).  Each chip (gate array) may have several thousands of transistors (many more blocks than what I modeled). The modern incarnation of gate arrays is FPGA (Field-Programmable Gate Array). These are fully manufactured blank so to speak, and are configured (or programmed) by the customer – no manufacturing required. They even can be re-programmed. These really are like writing to a blank CD-RW and as easy (as long as you know the coding language).
My Raytraced NMOS Inverter IC Mask Layout

My Raytraced NMOS Inverter IC Mask Layout (Modified)


By the way, I modeled another IC mask layout – an NMOS inverter.  I won’t bother describing that one, except to say the yellow area is a depletion implant, and the four metal lines at the bottom are inverter input, ground, inverter output, and Vdd respectively.  Also, in case it wasn’t obvious, in the NAND scene, the white back wall has many colored shadows/projections of the glass NAND mask layout because there’s more than one light – the lights are in different locations.  The effect is easier to see in my “Project GlassWorks…” video on my YouTube channel.
It’s too bad (for me) my university built an integrated circuit fabrication lab after I graduated (B.S. in Computer Engineering) – maybe I could have made some of these circuits.  Also, too bad they created a supercomputer after I graduated. But the professor responsible for creating it was on my thesis committee when I pursued my Masters (in Computer Science), so I did get to see it during its construction.

On another subject, I did design a simple 16 instruction microprocessor for a homework assignment.  Maybe it could be made using a gate array.  Of course, each one of those boxes contains many logic gates, so it’s really more than it appears.
16 Instruction Microprocessor I Designed


I created a YouTube video showing all of this and some more stuff:

Also, I created a video showing the CMOS circuits for NAND, AND, NOR, and OR as well as the SPICE analysis of these circuits using various SPICE tools for Windows/Mac and UNIX/Linux.  This video shows you how to use these tools to simulate the circuits.
And, I created a video showing the testing, simulation, and improvement of my above mentioned microprocessor. Logisim is used to do this. This video also shows various digital logic basics, such as multiplexers, decoders, flip flops. etc.


Tuesday, May 31, 2016

HDR Photography and Raytracing (aka What is HDR?)

What Is HDR?

That is the question I asked myself while reading various raytracing blogs and forums a while ago (they love using acronyms).  I can tell you it’s not a long-forgotten brother of a former president, and not a fancy cable for your hi-def TV.  HDR stands for High Dynamic Range.  In my previous blog post, I combined two things one wouldn’t think would go together – substitute teaching and raytracing.  This time I’m combining HDR photography and raytracing.

HDR Versus LDR / SDR

Most photos or raytracing output would be considered Low Dynamic Range (LDR) (also known as Standard Dynamic Range (SDR)).  This is because most image formats are based on 24-bit (3 byte) RGB color triples.  Each color component (red, green, and blue) is 1 byte which means it can store an integer value between 0 and 255 (0, 1, 2, … 255).  Some image formats use 32 bits (4 bytes) – the fourth byte being either unused padding or an alpha channel used for transparency; either way, it doesn’t effect the stored color.  HDR image formats typically use floating point RGB color triples.  These values can range from smaller than you can imagine to larger than you can imagine (I won’t mention specific ranges because that would depend on the format used).  Overly dark images in an HDR format would contain many pixels with a small RGB triple, for example (0.000561, 0.000106, 0.0002).  This value would be (0, 0, 0) in an integer RGB format, which would be black with information lost.  In the case of overly bright images in an HDR format, there might be a lot of large RGB triples, like for example, (26010.0125, 257.1, 280.6).  This value would be (255, 255, 255) in an integer RGB format (since without any special processing, values are “clamped” to a range of 0 to 255), which would be white with a definite information loss – the HDR version is red.  You might say “Why not just scale the values to fit between 0 and 255?”.  In some cases that would work (but information / precision would be lost).  However, what if the image contains both super light and super dark areas?  HDR images can store “a greater dynamic range between the lightest and darkest areas” [Wikipedia].

HDR Used in Raytracing

Saving raytracer output in an HDR format is a no-brainer so to speak, since internally the RGB triples are already floating point, with, for all intents and purposes, no limitations of range.  The only thing that changes is the actual writing of the file.  I chose to support both Radiance’s “HDR” format and the “PFM” format (Portable Float Map) in my raytracer (in addition to various LDR formats).  Examples of HDR versus LDR appear below.  The two images show a scene that purposely has a super bright light.  The LDR version is quite useless, but the processed HDR version looks fine.
 
Raytraced scene with super bright lights saved with normal LDR format.


Raytraced scene with super bright lights tone mapped from an HDR image.
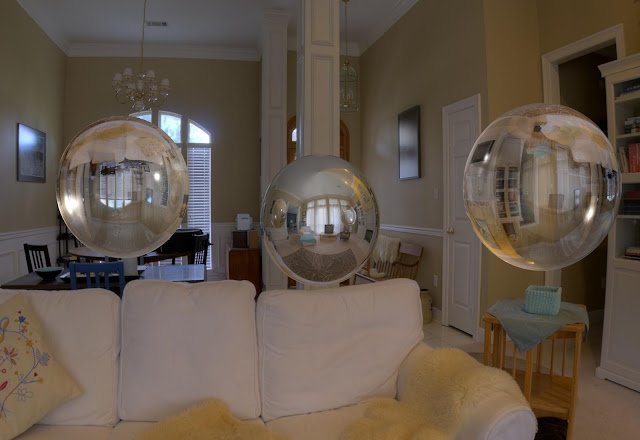
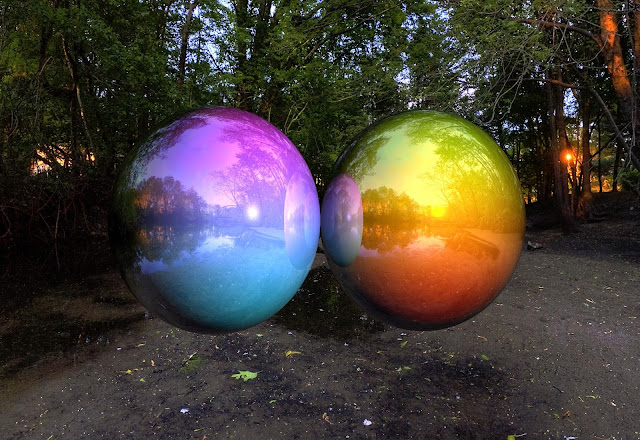
Loading HDR images in a raytracer is not necessarily a no-brainer.  Loading would mostly be used for what’s called “texture mapping” – a method of applying a texture to an object.  The texture routines could also be used for what’s called “environment mapping” – a method of easily applying an environment (that an object is in) without having to actually create the environment.  I chose to support the “PFM” format for loading.  Examples of environment mapping appear below.  In one of the pictures there are three spheres – two glass (showing refraction) and one silver (showing reflection).  The other picture shows two colored reflective spheres.  Of course, it doesn’t have to be spheres, it can be any objects.  I used spheres here to show that the environment really does completely surround the objects.  The HDR environment maps I used are freely available and can be downloaded at http://www.hdrlabs.com/sibl/archive.html
A raytraced environment mapping example with both glass and silver balls.

A raytraced environment mapping example with colored reflective balls.

HDR Used in Photography

This application of HDR will probably be more interesting to most people, but also more controversial.  Mostly, people either love or hate HDR photography.  Some people love it, then hate it.  It tends to depend on whether you’re into realism or artistic manipulation.  I guess my preference would be to have both versions available.

Some digital cameras can use an HDR format, most can’t.  Also. some digital cameras have features like “auto exposure bracketing (AEB)”.  Neither of these is necessary to do HDR photography (but they are helpful).  Exposure bracketing is a technique of taking many photos of the same scene with different exposures.  The resulting images can be combined to form an HDR image.  Usually, one photo is taken with the desired (or close to the desired) exposure, at least one photo is taken darker (under-exposed), and at least one photo is taken lighter (over-exposed).  Care should be taken to ensure the scene doesn’t change while the set of photos are taken, since the photos need to be combined.  You can change the exposure by changing the shutter speed or ISO speed or aperture depending on what controls your camera has. The easiest way is to use EV compensation if your camera has that setting. Typically, -2 EV, 0 EV, and +2 EV would be used, but -1, 0, and +1 and even -2, -1, 0, +1, +2 (5 photos instead of 3) are good values as well.  Cheaper cameras might only have two exposure settings.  With these cameras, you could either try to do it with only two images, or you could change the light level of the scene (different lights, etc.).  Auto exposure bracketing will automatically do all the exposure bracketing for you.

Once you have the bracketed images, you need to combine them using software.  One program which will do this nicely is HDRsoft’s Photomatix Pro.  A free trial version is available.  Luminance HDR and picturenaut are free programs which can also be used (with less satisfactory results, in my opinion).  Once the images have been combined into an HDR image, generally tone mapping should be applied, especially if an LDR image is desired (in the end).  The myriad of tone mapping operations are too vast to cover in this blog posting, so my advice is to just experiment with different settings.  There usually is an “Undo” function, but if not, you could always start over.

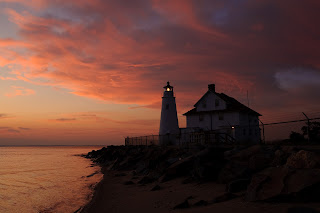
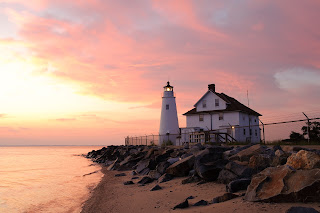
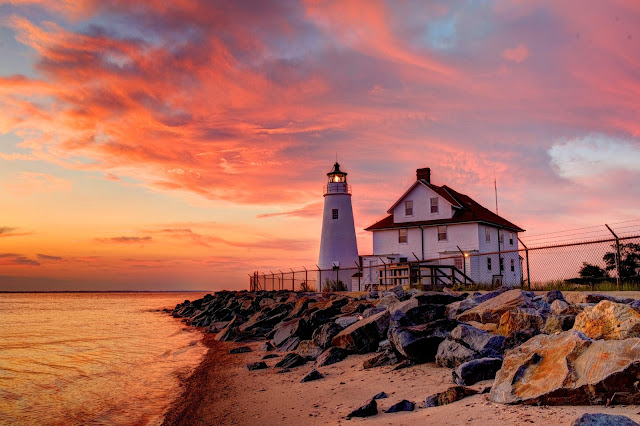
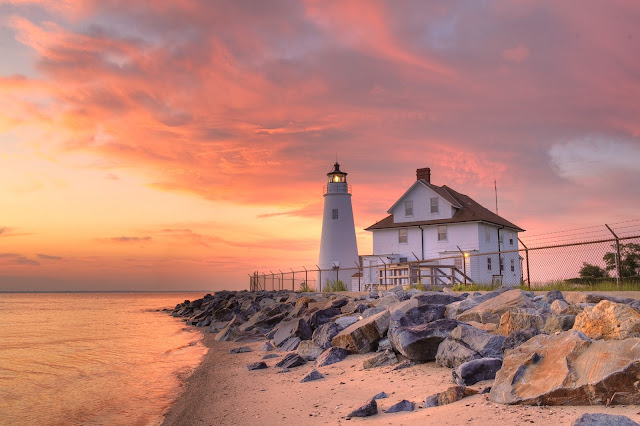
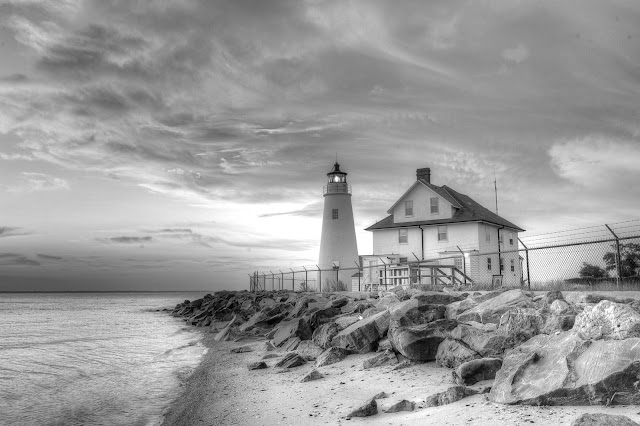
To illustrate what can be done with HDR photography, I’ve done some test images using photos of Maryland’s Cove Point Lighthouse (which are copyrighted by Ferrell McCollough and provided by HDRSoft (permission was granted to use these photos)).  The three photos from their set are of normal exposure, over-exposed, and under-exposed.  The results tend to be somewhat surreal.  Furthermore, to really test what can be done, I also tried using just two source images: under-exposed and over-exposed.  Everyone can agree neither of the two source images are very desirable as is (due to the exposure settings), but when combined, the result is much better.  Even HDR photography haters would have to agree.

To see some remarkable examples of HDR photography, do an internet search for HDR photography.  There are quite a few pages with titles like “50 best HDR photos” or “50 Incredible Examples of HDR Photography”.

Lighthouse underexposed source photo (copyright Ferrell McCollough and provided by HDRSoft)

Lighthouse normal source photo (copyright Ferrell McCollough and provided by HDRSoft)

Lighthouse overexposed source photo (copyright Ferrell McCollough and provided by HDRSoft)

Lighthouse processed (fused) using Ferrell McCollough’s normal, over, and under photos.

Lighthouse processed (tonemapped) using Ferrell McCollough’s normal, over, and under photos.

Lighthouse processed (tonemapped/greyscale) using Ferrell McCollough’s normal, over, and under photos.
Lighthouse processed (fused) using Ferrell McCollough’s over and under photos.

Final Thoughts

One interesting application of HDR images is web-based viewers which allow you to interactively change the exposure and apply tone mapping.  One such webpage is at:
http://hdrlabs.com/gallery/realhdr/
Two more webpages are at:
http://pages.bangor.ac.uk/~eesa0c/local_area/local_area.html and http://www.panomagic.eu/hdrtest/
Using a program called pfsouthdrhtml (part of the pfstools package), you can create webpages like these (but without the tone mapping selections of the first webpage).  picturenaut can also be used.  Also, a nice tutorial which goes into more detail of creating an HDR photo (warning, though, his version of Photomatix is different than mine and perhaps yours, so some interpretation is necessary) is at: http://marcmantha.com/HDR/Home_Of_Worldwide_HDR.html

Well, happy experimenting!

Addendum:  The “bangor” link and the “marcmantha” link seem to be dead links.  However, the new location of the bangor site is: http://www.cl.cam.ac.uk/~rkm38/local_area/local_area.html


I created a video showing all of the HDR images in HDRLabs' sibl archive mentioned earlier (in the raytracing/environment mapping section). It's a 360 degree vr video, so your browser and/or hardware will need to be capable of viewing it correctly.


Thursday, March 27, 2014

My Hypothetical Day as a Substitute Teacher (aka Raytracing is Fun for Everyone)


A raytraced virtual art gallery I created using a raytracer I wrote. It includes drawings of girls I drew.
A raytraced virtual art gallery I created using a raytracer I wrote. It includes drawings of girls I drew
 

   I've often thought that if, for some reason, I ever ended up being a substitute teacher, I would offer the students a choice.  Do the boring assignment their normal teacher wanted them to do - and let's face it, nobody feels like doing that when the teacher's not around - or learn how to do what makes Pixar films, for example, possible.  Let's assume they chose the latter.  Then I would show them how to write a raytracer.  Of course, since, let's assume, this is not a computer programming class (in which case I would be preaching to the choir anyway), not everyone would know how to program a computer or know the language I would be using.  So, most of the stuff would have to be "spoon fed" to them.

  One might wonder, "Well then, what's the point?"  The point is that raytracing not only covers the subjects of computer programming, but also math, physics, art, language, and depending on how the raytracer is used, chemistry, biology, and many other fields.  So, hopefully, it would be a way of showing how all those subjects are actually useful in the real world.  And once the students see how easy it was, admittedly because of the spoon feeding mentioned earlier, and see the nice results, who knows what interests might be sparked.  Perhaps, unrealistic wishful thinking, but hey, no one wanted to do the assigned work anyway.  I bet the normal teacher and the administration wouldn't like me, but who knows.  Plus, I've read that the "new way" of teaching in this era of Google, smartphones, and spell check is "how to think" rather than just facts and dates.

   So, you might be thinking, "Ok, I'm sold, so what is raytracing?".  Well, imagine looking out your window, scanning every inch of your window as you look out at what's outside.  You see a car with shiny chrome with reflections of nearby objects.  And someone left a glass of water on the car.  You can see what's on the other side of the glass, through the glass and water - it looks distorted or bent.  You see shadows.  You see some parts of the car getting more sun than other parts.  In a sense, you've just raytraced.  What a raytracer does is send out mathematical rays of light out from the viewer's eye (or camera) through a screen (in the mathematical sense) searching for the nearest object (in the virtual scene) in the ray's path.  When a ray hits an object that is reflective and/or refractive it uses the law of reflection and Snell's Law to determine how the ray is to be altered. These laws are two of those things in Physics class you thought you would never see again.  Once the ray is altered in the appropriate manner, it once again searches for the nearest object in its path, until there's nothing left in its path, or a limit of how much to search is reached. That covers computer programming (the raytracer has to be coded in some computer language), math (the calculations), and physics (the laws of light rays).

   Now for the other subjects.  The obvious connection to art is color.  In computer monitor terms, for example, every color is really a combination of the right amounts of red, green, and blue.  In computer printer terms, every color is a combination of yellow, cyan, and magenta.  This difference has to do with whether the medium is additive or subtractive.  For raytracing, though, red, green, and blue are used.  There are other color models which make calculating colors easier.  For example, in many of my raytraced scenes that appear on my websites, I used the Hue, Saturation, and Value color model to add a gradual progression of colors through the spectrum.  I also like the look of metal, so many of my scenes have a metallic look. This would involve art (color of certain metals) but also physics again (light characteristics of metals).  Art is also applicable to the building of complex looking objects using a combination of simple objects.  For example, in its simplest form, a car can be made from a box and four circles.  Not a very good looking car, but everyone could imagine it's a car.  Put in a few more boxes, some tori (doughnuts), some cylinders, and probably some spheres (balls), and it starts to look more like a car.  Language comes into play here.  You have to have some way of specifying the scene.  Box would be a noun.  White, for example, would be an adjective.  Other scripting constructs could be thought of as verbs.  I realize this is stretching it a bit to say that this would help with grammar, but it does emphasize the importance of adjectives and nouns.

   Chemistry comes into play as one of the uses of raytracing, in the form of modeling complex (or simple) molecules.  As anyone who's seen a Pixar film would know, the characters in the film move (usually) in a human manner.  The human skeletal system is studied to make the characters walk in a more believable manner.  Thus, biology comes into play.  The method of raytracing has even been applied to sound instead of light, to model how sound propagates through a hallway, window, door, etc. and bounces off walls.

   Raytracers can range from the very simple to the very complex.  I've even seen a raytracer's code printed on a business card.  That shows how simple a raytracer can be to write (of course, any raytracer that short would be very limited and not very useful).  I wrote my raytracer on my Commodore Amiga computer but I would often run it on a SUN Workstation (UNIX) because my Amiga wasn't fast enough for complex scenes.  I eventually ported my raytracer to MS-DOS, Windows, and Linux / X-Windows.  It's come a long way throughout the years.  It didn't take years to write, of course; I did many other things between my excursions with my raytracer.

   In case you're sold on raytracers but not on writing your own, there are plenty of commercial and free raytracers.  POV-Ray being an excellent free one.  Well, happy raytracing!
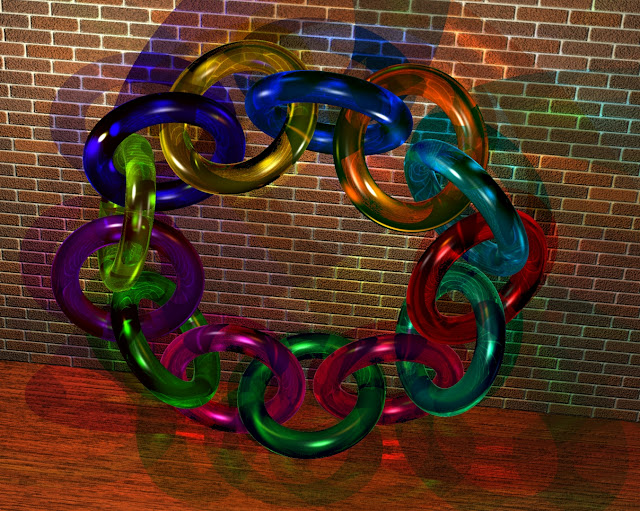
A raytaced set of colored glass Moebius rings. Follow the color coding to see the twisting of the big ring.
A raytraced colored glass integrated circuit mask layout of a NAND logic circuit made from a gate array.


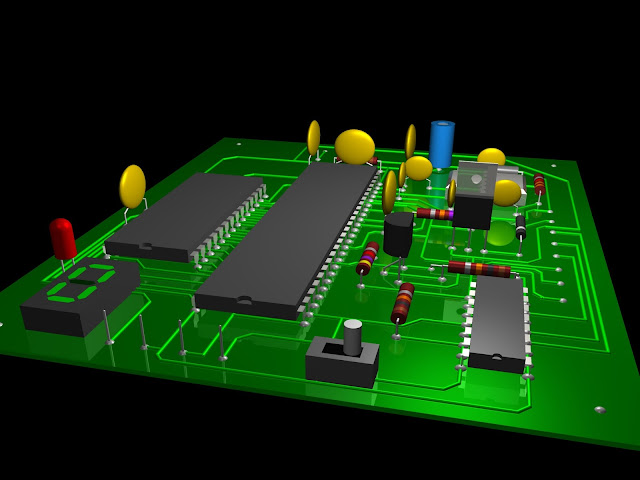
A raytraced printed circuit board (PCB)
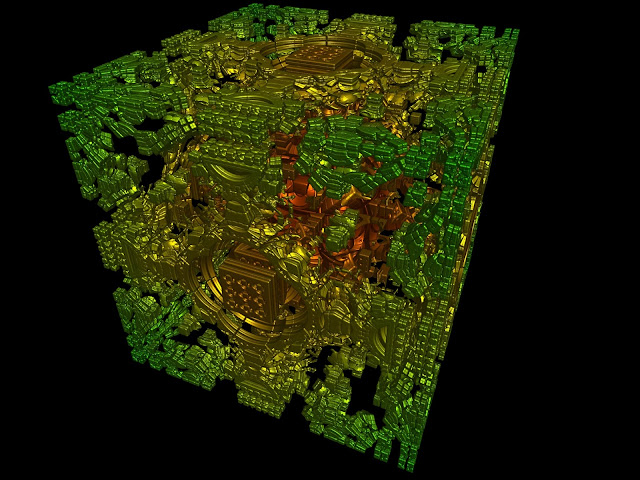
A raytraced Mandelbox fractal
A raytraced Mandelbox fractal.
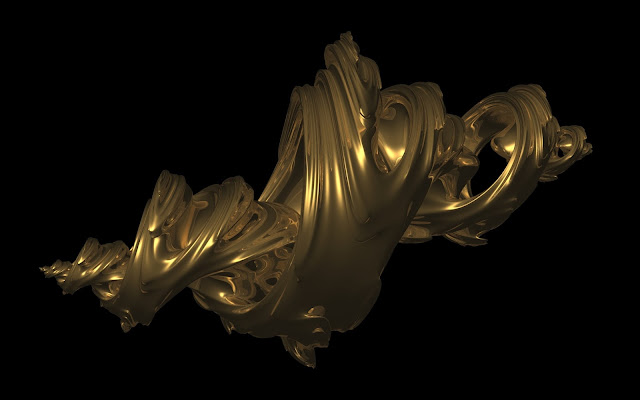
A raytraced gold 4d quaternion Julia fractal
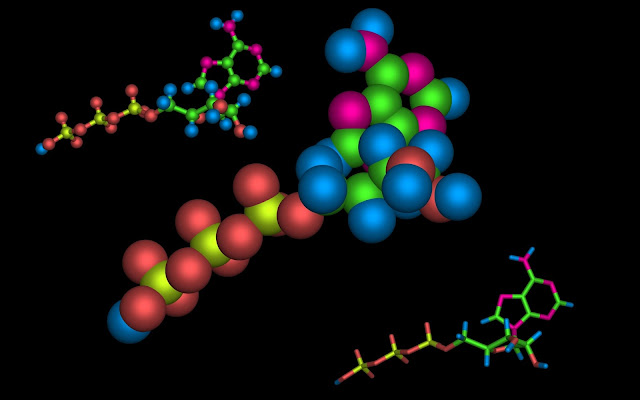
Different ways of showing an ATP molecule using raytracing

I created many raytracing videos. Here is one of them. Go to http://youtube.com/mrmcsoftware/videos for more videos.